
Those of you following my blog will know I trade CFDs and throughout 2019, I’ve been showing my progress. Although I trade with a short term view, and use technical analysis to help with my trading decisions, I do so with companies I’m familiar with, so that I can also apply some fundamentals to them. Moving averages are very useful in helping guide my trading and take profit levels.
For those of you new to trading, or new to the stock market in general, here’s a primer on what I personally feel works great for me as an indicator of the trend the stock is in, and potential buy/sell levels because they also act as levels of support/resistance.
What is a Moving Average? (MA)
A moving average is simply a technical indicator that aggregates and averages the stock price of any company over a designated period of time. The result is a single trend line that smoothens any spikes or drops and gives us (as the name suggests) the average price of this stock over N days/period.
What are the different types of Moving Averages?
There are 2 main types of MAs. Simple Moving Average (SMA), and Exponential Moving Average (EMA).
For SMAs, they are simply a trend line showing the average over the last 10, 20 or 50 days of the price of a stock. (The period is entirely of your choosing, depending on whether you’re a short or longer term trader.)
EMAs give more weight to recent price action, and so react to price movements quicker, and are able to give you a more accurate reflection of recent action.
Which is better, you ask? Well, it really depends on your trading style. EMAs provide faster signals when a price is changing direction, but it is also vulnerable to giving false signals early.
I personally use SMAs because I trade with a medium term view, alongside other fundamental and more qualitative measures.
How do we use Moving Averages?
As a single trend line, the price above or below the trend line projects the current direction the price is in. If it is above the MA, then the stock is in an uptrend, if it lies below, then it is in a downward trend.
Using multiple SMAs in a chart can help you set targets in a channel, and help you make trading decisions when the price lies within the averages.


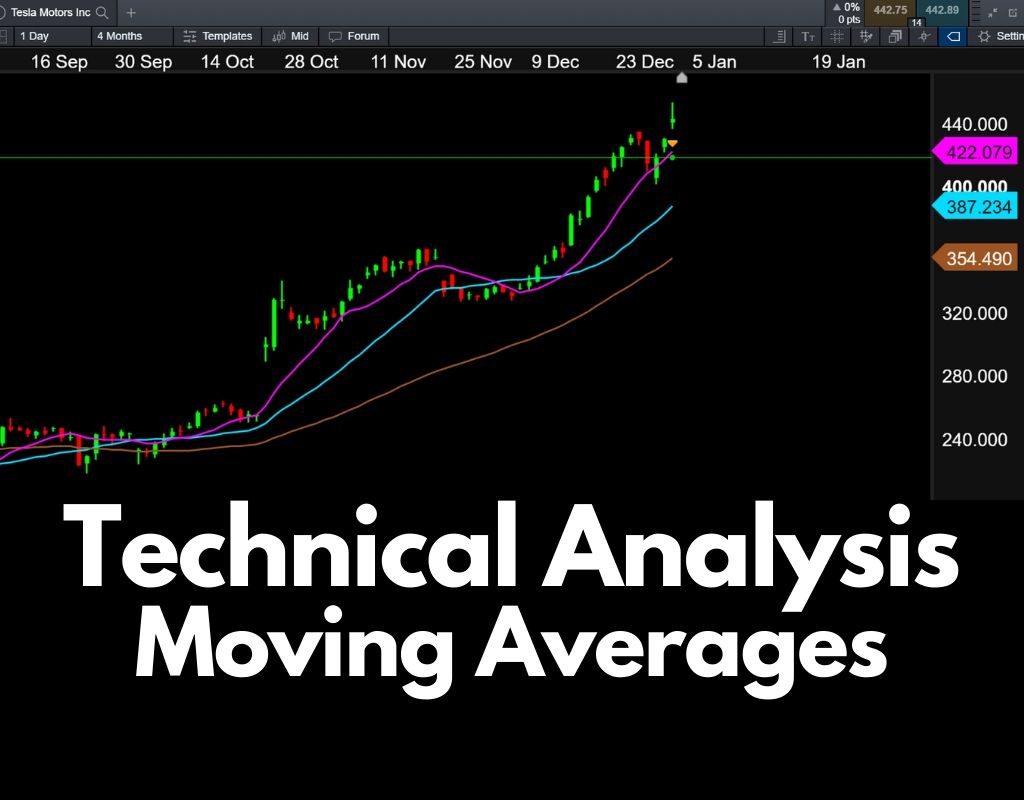
You can see in the chart above for Tesla (TSLA), I plotted SMAs of 10, 21 and 50 days. Tesla’s recent bull run meant the stock hasn’t traded below the 50-day SMA since late September. In fact, for the majority of the time, it has been trading above all SMAs.
You can also see in this chart, that the 21-day SMA acted as a support level when it dipped a little around mid November.
Personally, I think Tesla’s rise from the $240 levels to today’s price of ~$440 is a little too fast too furious, and with the Iran situation potentially boiling over, we could see a pullback for Tesla, back to the 21-Day SMA levels of ~$385 over the coming weeks.
Using fundamental analysis, macroeconomic factors, and combining it with some technical indicators, can give me a pretty good idea of where to put in my trades.


In the above example, we see Pinterest suffered a huge drop post the last earnings, but it seems like the price has bottomed out, and in fact, over the last 2 trading days, the 10-day SMA has cross over the 21-day SMA.
This could signal a price reversal in process. Although PINS missed their last earnings, revenue grew by 47%. The >20% drop is share price seemed like a huge overreaction to a good platform with great growth rates, and a potential acquisition target.
Based on this and current price action, I believe PINS will close the gap after the next earnings.
So, this is how I use moving averages in addition to doing some qualitative research on the stocks. Hope this has been helpful.
Check out my other post if you’re interested in reading about candlestick patterns.
Pingback: Understanding Candlestick Patterns | Side Hustle Rich
Pingback: Understanding Candlestick Patterns | TheFinance.sg