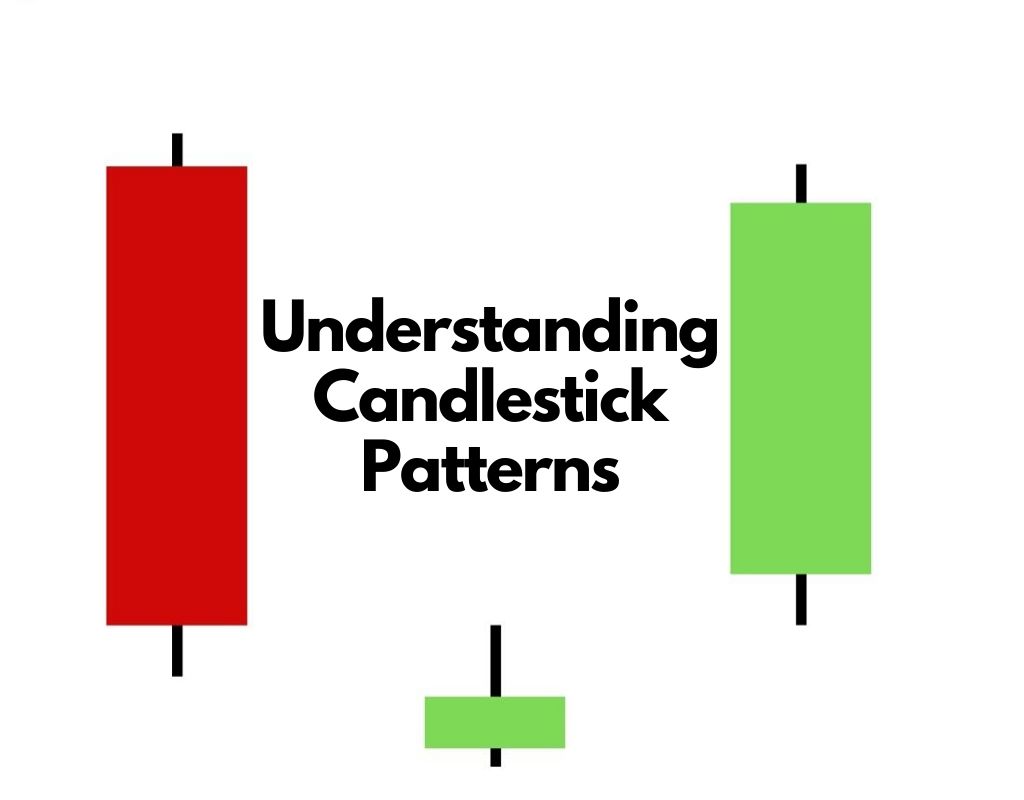
As a stock trader using technical analysis, understanding candlestick patterns, and identifying bullish and bearish candlestick signals are an important toolkit to have. In this post, I will introduce the idea of reading into the basics of candlestick analysis, and take a look at some bullish and bearish candlestick charts.
You can also read more about my post on Moving Averages if you’re interested in that.
Basics of a Candlestick Chart
The above graphic shows the tenets of a candlestick. The basic attributes of a candlestick, whether bullish or bearish, contains the following:
- The open price
- The closing price
- The body
- Upper and lower wicks
Seen together in a candlestick like this, there are patterns that can be discerned, and signals either a bullish trending pattern, a bearish trending pattern, or a potential reversal of the trend at play.
Bullish Candlestick Patterns
Technical traders initiate positions on various patterns, and these patterns over time have proven themselves to be reliable. Of course, these patterns may also be a self-fulfilling prophecy, since if enough people believe in it, they will act on it, making it… well, come true. Whatever the case, perception is reality. And that is all that matters. Here are some bullish patterns
Three White Soldiers
The Three White Soldiers pattern emerges at the end of a bearish trend. Other attributes of this pattern is that there needs to be clean, decent sized candles with good volume for it to be considered as a true emergence of the pattern.
Morning Star
The morning star consists of three candlesticks. The first, a long bearish candle, the second with a short body and short wicks (it can be bullish or bearish), and the third, a long bullish candle.
The middle candle signifies that the bears are losing control and the bulls are coming in, while the third candle confirms the reversal.
Bullish Engulfing
The Bullish Engulfing pattern is a 2 candlestick indicator of a reversal from a bearish to a bullish trend.
The second candle completely engulfs the body of the first candle, signaling that buyers are in control. Do note that these candles can be printed often, so it’s important to note that the prior few candles are bearish candles, for a stronger indication.
Bearish Candlestick Patterns
On the flip side, we also want to know when a bullish trend may reverse and start to sell off. When it comes to charting patterns, a lot of bullish patterns can simply be inverted to signal a bearish trend evolving.
Three Black Crows
Three black crows appear when bears have completely taken over the bulls, and imprint three clear, distinct and strong bearish candles on 3 consecutive trading periods.
The candles should have long bodies and short or no wicks.
Evening Star
The Evening Star is a 3 candlestick pattern that signals the end of a bull run, and a reversal into bearish territory.
First candle continues the bullish trend, second candle shows the indecision of the markets, and signals hesitation on the buy side, and the third candle shows the bears taking control.
Bearish Engulfing
The Bearish Engulfing pattern is a 2 candle pattern, where the second bearish candle completely engulfs the first, shorter, bull candle. In my opinion, this is not a very strong indicator, and should be analysed in conjunction with other indicators for a stronger confirmation of the move.
So, here are the basics to candlestick patterns, and how to read a candlestick. Hope this is useful!

Pingback: Everything you need to know about Moving Averages | Side Hustle Rich