
We all know how Google Analytics is an amazing tool to observe and analyse huge data sets with. But sometimes, it is also extremely useful to do a deep-dive into a user level session centric report. This is where the user explorer report comes in really handy. The Google Analytics User Explorer report looks at each user (or really, browser on a device), and splits out session level details that can date back historically up to 2 years. These details include the page viewed, goals achieved, events triggered as well as session duration.
Where can I find the user explorer report?
Within Google Analytics, you can find the user explorer report under the Audience Reports.
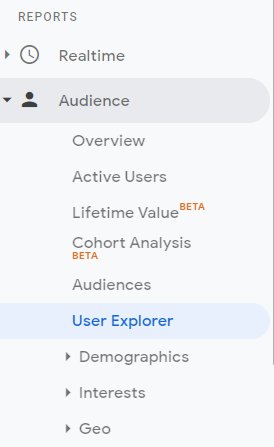
Once you click on that, you’ll see this:

What is a Client ID?
Now, each row references a Client ID. This client id (or Google’s cookie ID) refers to a browser on a device that visited this site. Pretty cool huh? You can further segment the users into segments from different countries, or filter them by goal conversion rates, and then drill in to each user to have a better sense of how they’ve been consuming content on your site.
The Client ID is a parameter assigned by Google Analytics, and by itself, it is anonymous. There are 2 parts to the Client ID. The first part is a randomly generated number, and the 2nd part is the timestamp of the creation of the cookie.
If your site has a login function, you can integrate or send that User ID data into Google Analytics, and they can then tie it up with the Client ID so that you have a view of what the known user did as browsing activity on your site before purchasing item X.
How can you use user explorer report?
Customer Experience
With all of this data, you can export their site behavior data into a CRM platform, or a Customer Data Platform (CDP), match the client id to an actual customer and have an extremely granular look into each customer’s activity on the site.
If you’re an ecommerce site, you can use this information to track customer loyalty, how often they come back, and how they’re using the site on a granular level to make navigation an even better experience.
Customer Personalisation / Recommendation
When you have such detail on a customer’s browsing and purchase habits, you’re also able to model and create a very personalised experience specifically catered to his or her needs based on historical behaviour.
Product Development
Nothing tells you more about how your users are using the product better than, well, seeing your users navigate through your product, on a session by session basis.
This helps you as a product manager to really see where the pain points are with regard to users being able to locate a certain feature for example, or using another feature in a way that you’ve never prepped for, and hence surface further product enhancements to improve the overall engagement and experience.
A fun experiment to find myself
So, I was keen to see my own behaviour on my site, so I thought I’ll “find myself” among these Client IDs. There are a couple ways to find your analytics cookie id. You can install the GA Debug chrome extension, turn it on, go to your website, right click and go “Inspect”. This will open up the developer console, and you’ll see something like this below.
The parameter to watch out for is &cid.
Alternatively, you can go to your cookie storage on your browser (right click, inspect, go to application, cookies), look up _ga, and find your Client ID there. The value should look something like GA1.2.924568173.1585188025, where the bolded portion will be the Client ID.

Now that I’ve found myself, I can go look up my profile in detail, and see what activity I’ve been up to on my own site. You can see, referencing the list of IDs on the top image, that I’m the user on row 4.
Now let’s take a closer look at the browser/device level. Clicking into row 4 gives you this granular level of detail below.

Some details of “me” on the left panel include my Client ID and corresponding BigQuery ID, the device I’m using, the first date of acquisition, the channel of the first acquisition, as well as campaign, if any.
On the top right, you have total sessions, total session duration as well as revenue, transaction and goal completion rates.
The main portion of the screen shows the exact date, time, duration and pages I visited via this device, alongside any event triggers, goal completion or transactions made.
Pretty powerful stuff huh?