
I started this blog in November of 2018 on a whim, to document my trials and tribulations into various side hustles I was doing, and will try out, as well as an overall peek into my journey as I strive for FI as a family man.
A small part of the blog also evolved into providing blogging tips on how long SEO takes to produce results, useful Google Analytics reports, how to use Google Search Console etc. So I thought now would be a good time to share some blogging statistics and growth of this small personal space of mine across 2 years in 2019 and 2020. I even had 2 ebooks (self) published!
2019 Blogging Stats

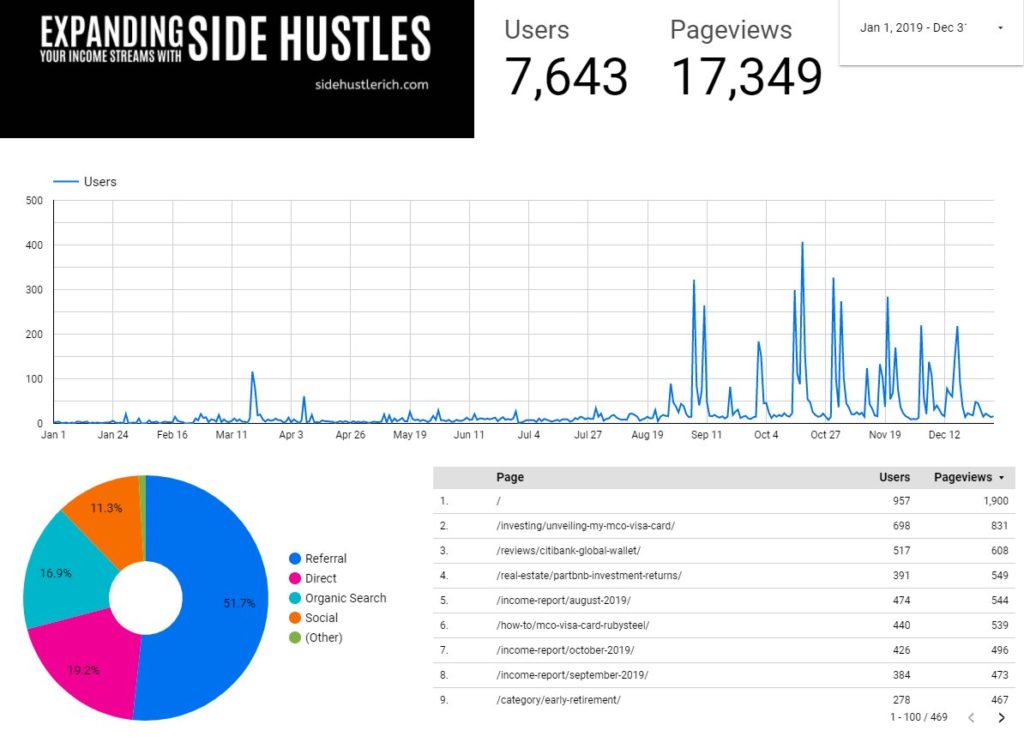
As you can see on the daily chart, as with any new site, the going will be slow. The bulk (51%) of my traffic in 2019 came from the referral channel, which was predominantly a couple of blog directories.
I started getting more regular traffic on a daily basis from May (no more 0 traffic days), which was when organic traffic was getting picked up on Google and some of my posts were getting surfaced on the Google SERPs.
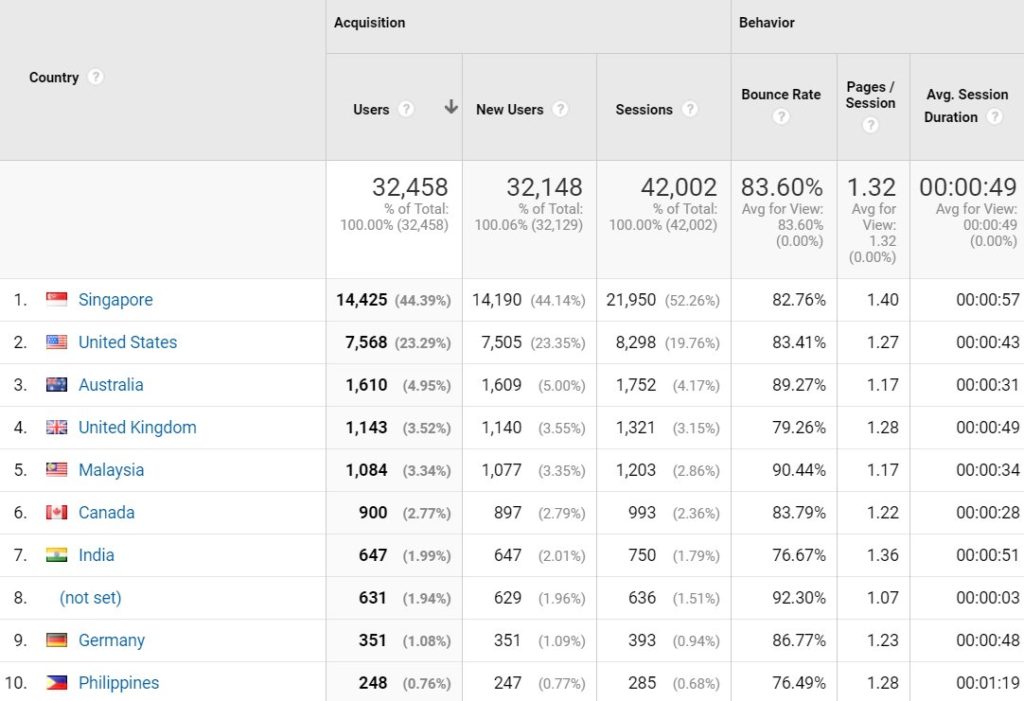
2019 Traffic by country

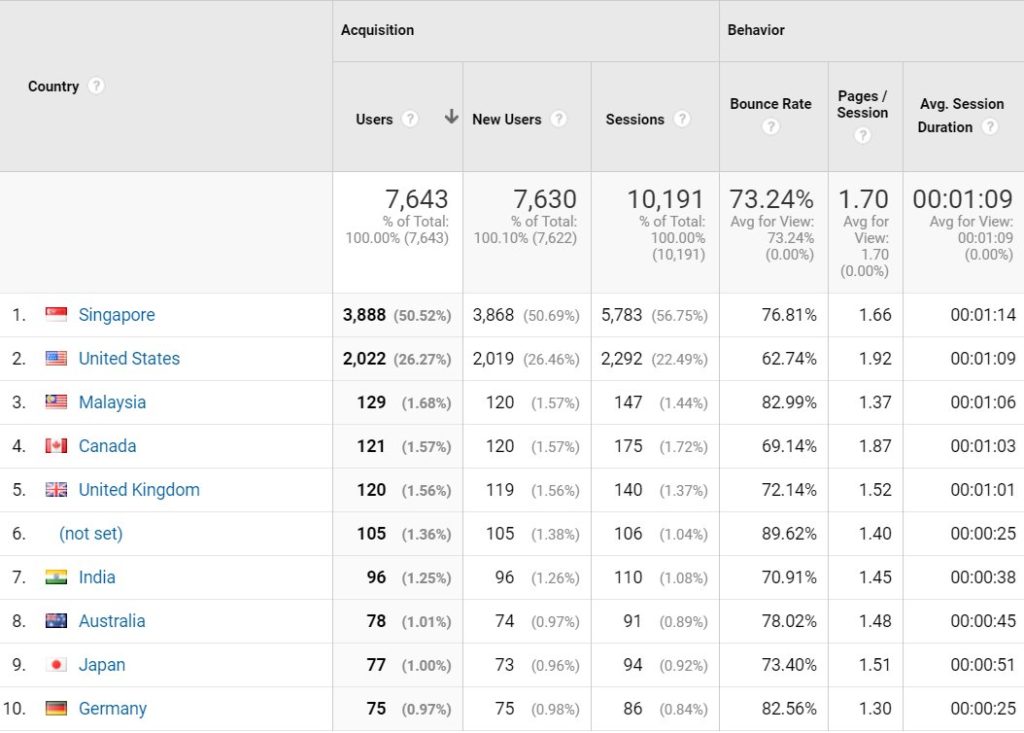
Here are the top 10 countries by traffic. No surprises that Singapore would rank top, since I’m based here. I try to have my content as globally relevant as possible, and since FIRE as a concept, really started in the US, they are number 2 in terms of traffic driver.
Interesting to note that US and Canada folks stick around the most. (lowest bounce rate with highest page views per session)
2020 Blogging Stats

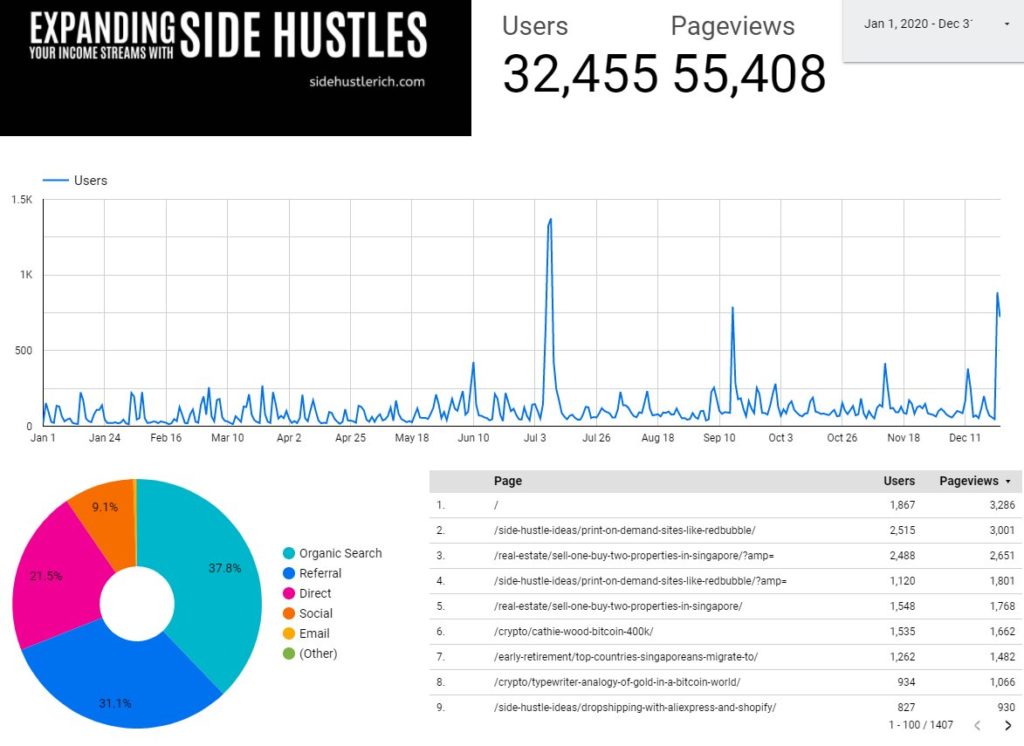
2020 has been good in terms of scaling my blog traffic. I managed to quadruple users to my site, while at the same time reduce reliance on the referral channel, having much more balanced traffic drivers between Organic, Referral and Direct. Social being the only channel I have yet to really work on and find a great strategy to scale.
I had a couple of posts going viral, bringing in >500 users in a day, which was great. There’s a good mix of top read articles spread across real estate, side hustles and crypto topics, which is amazing.

Overall I’m happy with the distribution of country traffic. It has scaled quite a fair bit, and reliance on Singapore and US traffic has dropped from 76% in 2019 to 67% in 2020. Previously every other nation was under 2%, where today we have Australia, UK, Malaysia and Canada all cracking above 2%.
Blog Post Output
I’ve been able to work on getting more posts out this year, given that I was not working a full time job for the entirety of 2020.

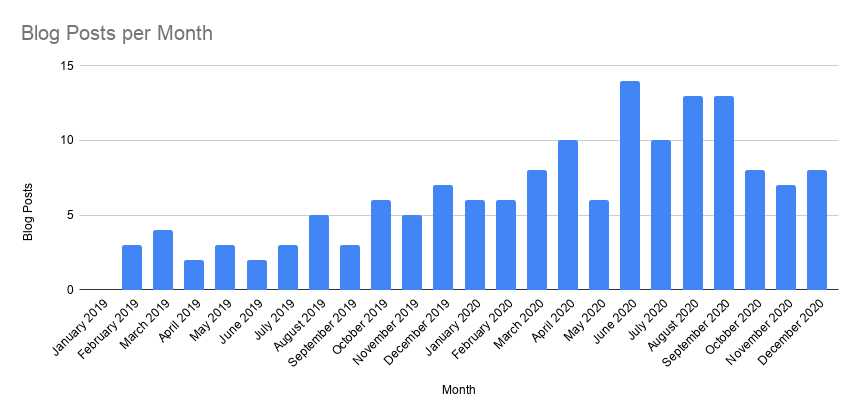
That helped build up a nice collection of content on my site, and incrementally adds weight overall to the site to build credibility. I’m not quite sure how to scale blog post production moving forward though, given this is a one-man site.
Well, even if my bank account has been impacted this year, it’s nice to see something else going up and to the right.
Merry Christmas everyone, and may we all be blessed with a much much better 2021.
Pingback: My Twitter follower growth across 2020 | Sidehustle Rich